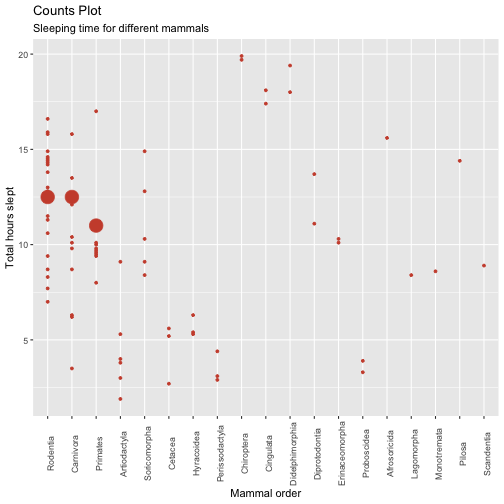
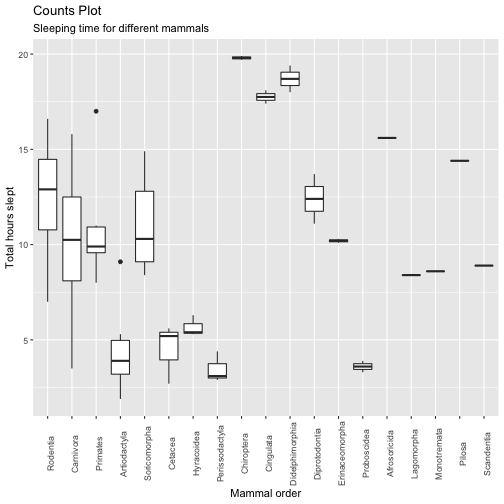
class: center, middle, inverse, title-slide # MLR with categorical predictors ### STAT 021 with Prof Suzy ### Swarthmore College --- <style type="text/css"> pre { background: #FFBB33; max-width: 100%; overflow-x: scroll; } .scroll-output { height: 70%; overflow-y: scroll; } .scroll-small { height: 50%; overflow-y: scroll; } .red{color: #ce151e;} .green{color: #26b421;} .blue{color: #426EF0;} </style> ## ANOVA model review In an ANOVA model, the predictor variable is categorical. Recall we write `$$Y_{j} = \mu_{j} + \epsilon$$` where `\(j = 1,\dots, k\)` and `\(k\)` is the number of levels in the categorical predictor. *** **Assumptions:** 1. `\(E[\epsilon]=0\)` 1. Homogeneity of variance (i.e. `\(Var(\epsilon)=\sigma^2\)`) 1. The random errors `\(\epsilon\)` are all independent. 1. The random errors, `\(\epsilon\)` are Normally distributed. (Only necessary for inference.) --- ## Simple Linear Regression model review In an SLR model, the both the predictor variable and the response variable are quantitative and we write the relationship between the two variables as `$${Y} \mid x = \beta_0 + \beta_{1}x + \epsilon.$$` *** **Assumptions:** 1. `\(E[\epsilon]=0\)` 1. Constant variance (i.e. `\(Var(\epsilon)=\sigma^2\)`) 1. The random errors `\(\epsilon\)` are all independent. 1. The random errors, `\(\epsilon\)` are Normally distributed. (Only necessary for inference.) --- ## Indicator variables An indicator/dummy variable is one that can only take on one of two possible values. This is purely a notational scheme for representing different levels of some categorical variable. If we have a variable with `\(k\)` unique categories, we only need to define `\(k-1\)` indicator variables to uniquely identify each data point as belonging to one category. E.g.) Suppose a mechanical engineer needs to determine if the effective life `\((Y)\)` of a lathe (a type of cutting tool) changes for the different sizes `\((x)\)` small, medium, and large. <img src="Figs/lathe.png" width="389" height="300" style="display: block; margin: auto;" /> --- ## Indicator variables ### Lathe life example We can define two indicator variables for tool size by letting `$$x_1 = \begin{cases}1, \text{ if small tool}\\ 0, \text{ if not small tool} \end{cases}\\ x_2 = \begin{cases}1, \text{ if medium tool}\\ 0, \text{ if not medium tool} \end{cases}$$` Suppose the first few rows of the data set look like... | Tool life | Tool Size | |-----------|-----------| | 12.2 | large | | 10.1 | large | | 15.6 | small | | 14.0 | medium| --- ## Indicator variables ### Lathe life example We can define two indicator variables for tool size by letting `$$x_1 = \begin{cases}1, \text{ if small tool}\\ 0, \text{ if not small tool} \end{cases}\\ x_2 = \begin{cases}1, \text{ if medium tool}\\ 0, \text{ if not medium tool} \end{cases}$$` We can re-code the data in terms of the indicator variables! | Tool life | `\(x_1\)` | `\(x_2\)` | |-----------|-------|-------| | 12.2 | 0 | 0 | | 10.1 | 0 | 0 | | 15.6 | 1 | 0 | | 14.0 | 0 | 1 | --- ## ANOVA as a MLR ### Lathe life example `$$Y \mid (x_1, x_2) = \beta_0 + \beta_1 x_1 + \beta_2 x_2 + \epsilon,$$` where `$$x_1 = \begin{cases}1, \text{ if small tool}\\ 0, \text{ if not small tool} \end{cases}\\ x_2 = \begin{cases}1, \text{ if medium tool}\\ 0, \text{ if not medium tool} \end{cases}.$$` For small tools: `\(Y \mid (x_1, x_2) = \beta_0 + \beta_1 + \epsilon\)` For medium tools: `\(Y \mid (x_1, x_2) = \beta_0 + \beta_2 + \epsilon\)` For large tools: `\(Y \mid (x_1, x_2) = \beta_0 + \epsilon\)` --- ## ANOVA as a MLR ### Lathe life example `$$Y \mid (x_1, x_2) = \beta_0 + \beta_1 x_1 + \beta_2 x_2 + \epsilon,$$` where `$$x_1 = \begin{cases}1, \text{ if small tool}\\ 0, \text{ if not small tool} \end{cases}\\ x_2 = \begin{cases}1, \text{ if medium tool}\\ 0, \text{ if not medium tool} \end{cases}.$$` For small tools: `\(Y \mid (x_1, x_2) = \beta_0 + \beta_1 + \epsilon = \mu_{small} + \epsilon\)` For medium tools: `\(Y \mid (x_1, x_2) = \beta_0 + \beta_2 + \epsilon = \mu_{medium} + \epsilon\)` For large tools: `\(Y \mid (x_1, x_2) = \beta_0 + \epsilon = \mu_{large} + \epsilon\)` --- ## ANOVA as a MLR in general Suppose we have a categorical predictor variable with `\(k\)` different groups. Let `\(Y\)` be the continuous response variable. The ANOVA model for these two variables is: `$$Y \mid (x_1, x_2, \dots, x_{k-1}) = \beta_0 + \beta_1 x_{1} + \beta_2 x_{2} + \cdots + \beta_{k-1}x_{k-1} + \epsilon, \text{ where}$$` `$$x_{j} = \begin{cases} 1, \text{ if individual is from category j} \\ 0, \text{ otherwise} \end{cases}$$` and `\(j=1,\dots, k-1\)`. Whatever level of the categorical variable is indicated by setting all dummy variables to zero is called the **reference group**. Since `\(\beta_3\)` (for example) is zero for any individual not in level 3, the coefficient `\(\beta_3\)` represents the average change in `\(Y\)` that we expect to see if a data point were to switch categories from the reference group to the third level. --- ## ANOVA in R ### Mammal sleeping data Let's build an ANOVA model for determining how the scientific order of a mammal is related to the number of hours it sleeps each night. Remember, it's really important to make sure that R recognizes the categorical variable as a variable of class type *factor*. .scroll-small[ ```r library("tidyverse") data(msleep) msleep2 <- msleep %>% mutate(order_cat = order %>% fct_infreq()) %>% select(order_cat, sleep_total) head(msleep2) ``` ``` ## # A tibble: 6 x 2 ## order_cat sleep_total ## <fct> <dbl> ## 1 Carnivora 12.1 ## 2 Primates 17 ## 3 Rodentia 14.4 ## 4 Soricomorpha 14.9 ## 5 Artiodactyla 4 ## 6 Pilosa 14.4 ``` ] --- ## ANOVA in R ### Mammal sleeping data By default, R chooses the **reference category** alphabetically. Since we used the *fct_infreq()* function from the *forcats* package, we instead told R to use the category with the most observational units as the reference level. .scroll-small[ ```r msleep2 %>% count(order_cat) ``` ``` ## # A tibble: 19 x 2 ## order_cat n ## <fct> <int> ## 1 Rodentia 22 ## 2 Carnivora 12 ## 3 Primates 12 ## 4 Artiodactyla 6 ## 5 Soricomorpha 5 ## 6 Cetacea 3 ## 7 Hyracoidea 3 ## 8 Perissodactyla 3 ## 9 Chiroptera 2 ## 10 Cingulata 2 ## 11 Didelphimorphia 2 ## 12 Diprotodontia 2 ## 13 Erinaceomorpha 2 ## 14 Proboscidea 2 ## 15 Afrosoricida 1 ## 16 Lagomorpha 1 ## 17 Monotremata 1 ## 18 Pilosa 1 ## 19 Scandentia 1 ``` ] --- ## ANOVA in R ### Mammal sleeping data If we wanted the reference category to be the factor with the fewest number of observational units we can modify the data with the *fct_rev()* function and then re-fit the model. Similarly, if we wanted the reference category to be a specific factor level we could coerce this using the function *fct_recode()*. .scroll-small[ ```r msleep3 <- msleep %>% mutate(order_cat = order %>% fct_infreq() %>% fct_rev()) %>% select(order_cat, sleep_total) msleep3 %>% count(order_cat) ``` ``` ## # A tibble: 19 x 2 ## order_cat n ## <fct> <int> ## 1 Scandentia 1 ## 2 Pilosa 1 ## 3 Monotremata 1 ## 4 Lagomorpha 1 ## 5 Afrosoricida 1 ## 6 Proboscidea 2 ## 7 Erinaceomorpha 2 ## 8 Diprotodontia 2 ## 9 Didelphimorphia 2 ## 10 Cingulata 2 ## 11 Chiroptera 2 ## 12 Perissodactyla 3 ## 13 Hyracoidea 3 ## 14 Cetacea 3 ## 15 Soricomorpha 5 ## 16 Artiodactyla 6 ## 17 Primates 12 ## 18 Carnivora 12 ## 19 Rodentia 22 ``` ] --- ## ANOVA in R ### Mammal sleeping data .scroll-output[ ```r ## Fit an ANOVA model using the aov() function ANOVA_mammals <- aov(sleep_total ~ order_cat, data=msleep2) ANOVA_mammals ``` ``` ## Call: ## aov(formula = sleep_total ~ order_cat, data = msleep2) ## ## Terms: ## order_cat Residuals ## Sum of Squares 1196.7145 427.3511 ## Deg. of Freedom 18 64 ## ## Residual standard error: 2.584059 ## Estimated effects may be unbalanced ``` ```r ## Fit an ANOVA model using the lm() function SLR_mammals <- lm(sleep_total ~ order_cat, data=msleep2) SLR_mammals ``` ``` ## ## Call: ## lm(formula = sleep_total ~ order_cat, data = msleep2) ## ## Coefficients: ## (Intercept) order_catCarnivora order_catPrimates ## 12.46818 -2.35152 -1.96818 ## order_catArtiodactyla order_catSoricomorpha order_catCetacea ## -7.95152 -1.36818 -7.96818 ## order_catHyracoidea order_catPerissodactyla order_catChiroptera ## -6.80152 -9.00152 7.33182 ## order_catCingulata order_catDidelphimorphia order_catDiprotodontia ## 5.28182 6.23182 -0.06818 ## order_catErinaceomorpha order_catProboscidea order_catAfrosoricida ## -2.26818 -8.86818 3.13182 ## order_catLagomorpha order_catMonotremata order_catPilosa ## -4.06818 -3.86818 1.93182 ## order_catScandentia ## -3.56818 ``` ] --- ## ANOVA in R ### Mammal sleeping data Compare the following output. What is the same? What is different? .scroll-output[ ```r ## Summary of the aov() model summary(ANOVA_mammals) ``` ``` ## Df Sum Sq Mean Sq F value Pr(>F) ## order_cat 18 1196.7 66.48 9.957 2.04e-12 *** ## Residuals 64 427.4 6.68 ## --- ## Signif. codes: 0 '***' 0.001 '**' 0.01 '*' 0.05 '.' 0.1 ' ' 1 ``` ```r ## Summary of the lm() model summary(SLR_mammals) ``` ``` ## ## Call: ## lm(formula = sleep_total ~ order_cat, data = msleep2) ## ## Residuals: ## Min 1Q Median 3Q Max ## -6.6167 -0.9341 0.0000 1.0167 6.5000 ## ## Coefficients: ## Estimate Std. Error t value Pr(>|t|) ## (Intercept) 12.46818 0.55092 22.631 < 2e-16 *** ## order_catCarnivora -2.35152 0.92734 -2.536 0.013673 * ## order_catPrimates -1.96818 0.92734 -2.122 0.037680 * ## order_catArtiodactyla -7.95152 1.19013 -6.681 6.72e-09 *** ## order_catSoricomorpha -1.36818 1.28023 -1.069 0.289219 ## order_catCetacea -7.96818 1.59038 -5.010 4.55e-06 *** ## order_catHyracoidea -6.80152 1.59038 -4.277 6.45e-05 *** ## order_catPerissodactyla -9.00152 1.59038 -5.660 3.83e-07 *** ## order_catChiroptera 7.33182 1.90845 3.842 0.000283 *** ## order_catCingulata 5.28182 1.90845 2.768 0.007376 ** ## order_catDidelphimorphia 6.23182 1.90845 3.265 0.001758 ** ## order_catDiprotodontia -0.06818 1.90845 -0.036 0.971612 ## order_catErinaceomorpha -2.26818 1.90845 -1.188 0.239031 ## order_catProboscidea -8.86818 1.90845 -4.647 1.73e-05 *** ## order_catAfrosoricida 3.13182 2.64213 1.185 0.240267 ## order_catLagomorpha -4.06818 2.64213 -1.540 0.128556 ## order_catMonotremata -3.86818 2.64213 -1.464 0.148079 ## order_catPilosa 1.93182 2.64213 0.731 0.467351 ## order_catScandentia -3.56818 2.64213 -1.350 0.181614 ## --- ## Signif. codes: 0 '***' 0.001 '**' 0.01 '*' 0.05 '.' 0.1 ' ' 1 ## ## Residual standard error: 2.584 on 64 degrees of freedom ## Multiple R-squared: 0.7369, Adjusted R-squared: 0.6629 ## F-statistic: 9.957 on 18 and 64 DF, p-value: 2.04e-12 ``` ] --- ## ANOVA in R ### Mammal sleeping data .scroll-output[ ```r ggplot(msleep2, aes(x=order_cat, y=sleep_total)) + geom_count(col="tomato3", show.legend=F) + ## This part plots the counts of observations relative to the dot size and uses a red/tomato color theme labs(subtitle="Sleeping time for different mammals", y="Total hours slept", x="Mammal order", title="Counts Plot") + theme(axis.text.x = element_text(angle = 90)) ## This part rotates the labels of the different categories by 90 degrees ``` <!-- --> ] --- ## ANOVA in R ### Mammal sleeping data .scroll-output[ ```r ggplot(msleep2, aes(x=order_cat, y=sleep_total)) + geom_boxplot() + labs(subtitle="Sleeping time for different mammals", y="Total hours slept", x="Mammal order", title="Counts Plot") + theme(axis.text.x = element_text(angle = 90)) ``` <!-- --> ]